Stable rates, flat shipping volumes and a decrease in operators marked 1Q24
Another first quarter is in the books, and the data is out. While statistics surrounding rates, volumes and market conditions are important, it’s the interpretation of these stats that allows businesses to prepare for potential disruptions.
Outside of January’s weather disruption, this past quarter has brought about favorable rates for shippers and flat shipping volumes. We remain in an unbalanced freight market, with the supply of capacity exceeding shipper demand. Continued carrier exits will bring more balance to this supply/demand equation. Continue reading for insight into what these trends could mean for you.
Rates remain favorable for shippers
Following the trends of 4Q 2023, the first quarter of 2024 was marked by decreasing rates and year-over-year rate reductions. Changes were more noticeable in reefer rates than dry van.
Dry van rates
The year started with both contract and spot rates lower than 2023’s rates. DAT contract rates remained flat in 1Q but are down year-over-year. As new awards are onboarded, dry van contract rate trends continue to be favorable for shippers. Spot rates also slid, sitting at 8.2% below 2023’s reported average per mile.
Reefer rates
Reefer spot and contract rates showed a more pronounced downward direction. Like van rates, both contract and spot reefer rates started and ended below 2023’s rates in 1Q. Spot refrigerated rates declined 3.4% through January and continued to drop, settling at 14.8% down year-over-year at the end of the quarter.
Volumes remain relatively flat
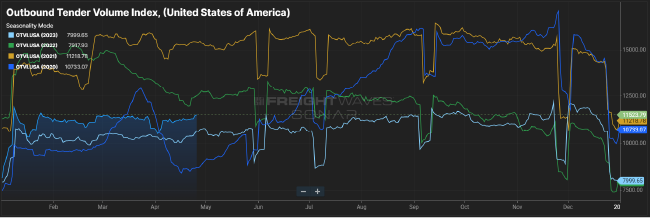
While rates remain low, volumes have ultimately remained flat outside of brief seasonal volatility. Volumes briefly dipped in February but rallied late in the month, only to dip again with the Easter holiday in March. They have since rebounded and are 10.4% above 2023 volumes overall.
If following the current trend, volumes will remain light, with the first opportunity for increases along seasonal trends expected through 2Q. If more loads enter the marketplace, there will be more competition amongst shippers with rates adjusting upward along seasonal shipping patterns.

Image Data Source: FreightWaves SONAR Outbound Tender Volume Index
Tender rejection rates bring us back into unbalanced territory
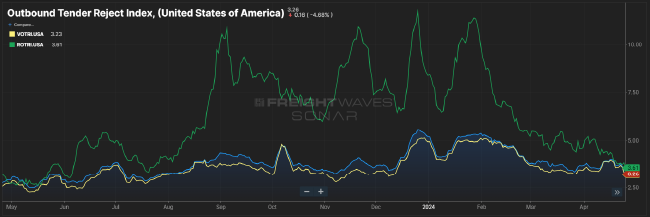
Late April tender rejection rates are 3.26%, below the 5-7% benchmark, which indicates a balanced market. Reefer rejections fell drastically mid-first-quarter due to improved weather conditions and sit at 3.61% at the time of publication.
Van rejection rates were steadily declining from an opening position of 5.05% to 3.75% as winter weather subsided. Current van rejections are at 3.23%.
Softer demand and low spot market rates are keeping tender rejections low. Rejections could consistently but slowly increase as new contract awards are onboarded at subpar margin levels and seasonal markets heat up. We may be beginning to see a more balanced market for shippers and carriers as we move into 2Q, but only if trends continue on their current trajectory.

Image Data Source: FreightWaves SONAR Outbound Tender Rejection Index
Fuel prices down amid increased production
Diesel fuel prices are down following record domestic crude oil production levels. U.S. crude oil production averaged 13.3 million barrels per day at the end of 2023. From 2018-2023, the U.S. produced more oil and gas per year than any other country has ever produced. This boom may keep fuel prices stable if the trend continues through the year.
Fuel prices continued down this path, with a quick spike in Week 7 associated with the unplanned outage at BP’s Whiting, IN refinery. Increased domestic production is helping to push prices lower, although prices did rally towards the end of 1Q, increasing 1.6% overall or $0.65/gallon. Low fuel costs may provide some relief for carriers as they are accepting tenders with lower rates.
Operating authorities down but much higher than pre-pandemic
Active carrier authorities are continuing to fall, but there are still an estimated 95,000 more carriers in the truckload marketplace than before the pandemic: 37.4% more authorities than in March 2020.
Since March of 2023, net active authorities have fallen by about 24,500. This indicates that capacity may shift from independent carriers to large operators as smaller carriers start to exit the marketplace at a slow rate. These carrier departures could be escalated with a historically soft quarter in 2Q, but that remains to be seen.
Upcoming events and trends
As 2Q takes shape, it’s important to note upcoming trends and potential obstacles:
DOT Week is coming
The CVSA International Roadcheck, or DOT Week, is scheduled for May 14-May 16, 2024. Historically, this brings increased carrier costs and reduced capacity as many carriers take this week off to avoid operational delays due to roadside inspections. Watch out for any rate jumps, as carriers may temporarily exit the marketplace during this period.
Retailers are shifting shipping strategy
According to the Federal Reserve Economic Database, retailer inventory levels have stabilized, with inventory to sales increasing to 1.33 in January 2024, up from 1.31 in December 2023. Destocking appears to be over, and retailers are beginning to shift back to a just-in-time inventory management strategy. Retailers are only stocking what they need and are avoiding overstocking their shelves. As retailers shift to this strategy, rates may be influenced by fewer extremes in demand.
Understand the truckload marketplace to make better shipping decisions
At ArcBest, we know the importance of data for both shippers and carriers. With expert insight into the current truckload market, we’re positioned to help you succeed no matter the current trends. With a full suite of transportation solutions for any shipper, including full truckload, contact us today and trust ArcBest with your future freight moves.
New to shipping FTL? Learn about the nuances of truckload shipping through the shipper’s guide to the truckload marketplace.


