

Truckload Market Update: May 2025
Spot pricing continues to show small year-over-year growth from a linehaul perspective, but the year-over-year decline in diesel has the total rate stuck in neutral. Considerable uncertainty exists in the current market due to a combination of trade policy, changing customer demand and tightened inventory management. Domestic freight volume declined through Q1, and import volumes rose as shippers front-loaded inventory in advance of the expected changes in U.S. tariff policy. Contract rates are running even from a year-over-year perspective and could begin to show year-over-year growth in the second half of the year if demand picks up and spot rates continue their ascent. Supply remains available in the marketplace, and an earlier peak season driven by another round of inventory frontloading could delay carrier attrition through 2025.
Let’s take a closer look at where we were and where we’re heading.
Rate trends and fuel costs
DAT National Contract Linehaul rates began to report slight year-over-year expansion beginning in March and continues through the time of this report. Contract rates appear to be at their cycle floor but should slowly increase over the upcoming quarters. Historically, contract rate trends trail spot rate trends by 60 to 90 days.
Spot linehaul rates remained in inflationary territory in April for the ninth consecutive month, up 3.5% from 2024’s April report. While this year-over-year growth points to a recovering freight market, rates declined sequentially through Q1 and into April along seasonal lines following a weather-impacted January report of 3.1% sequential growth from December.
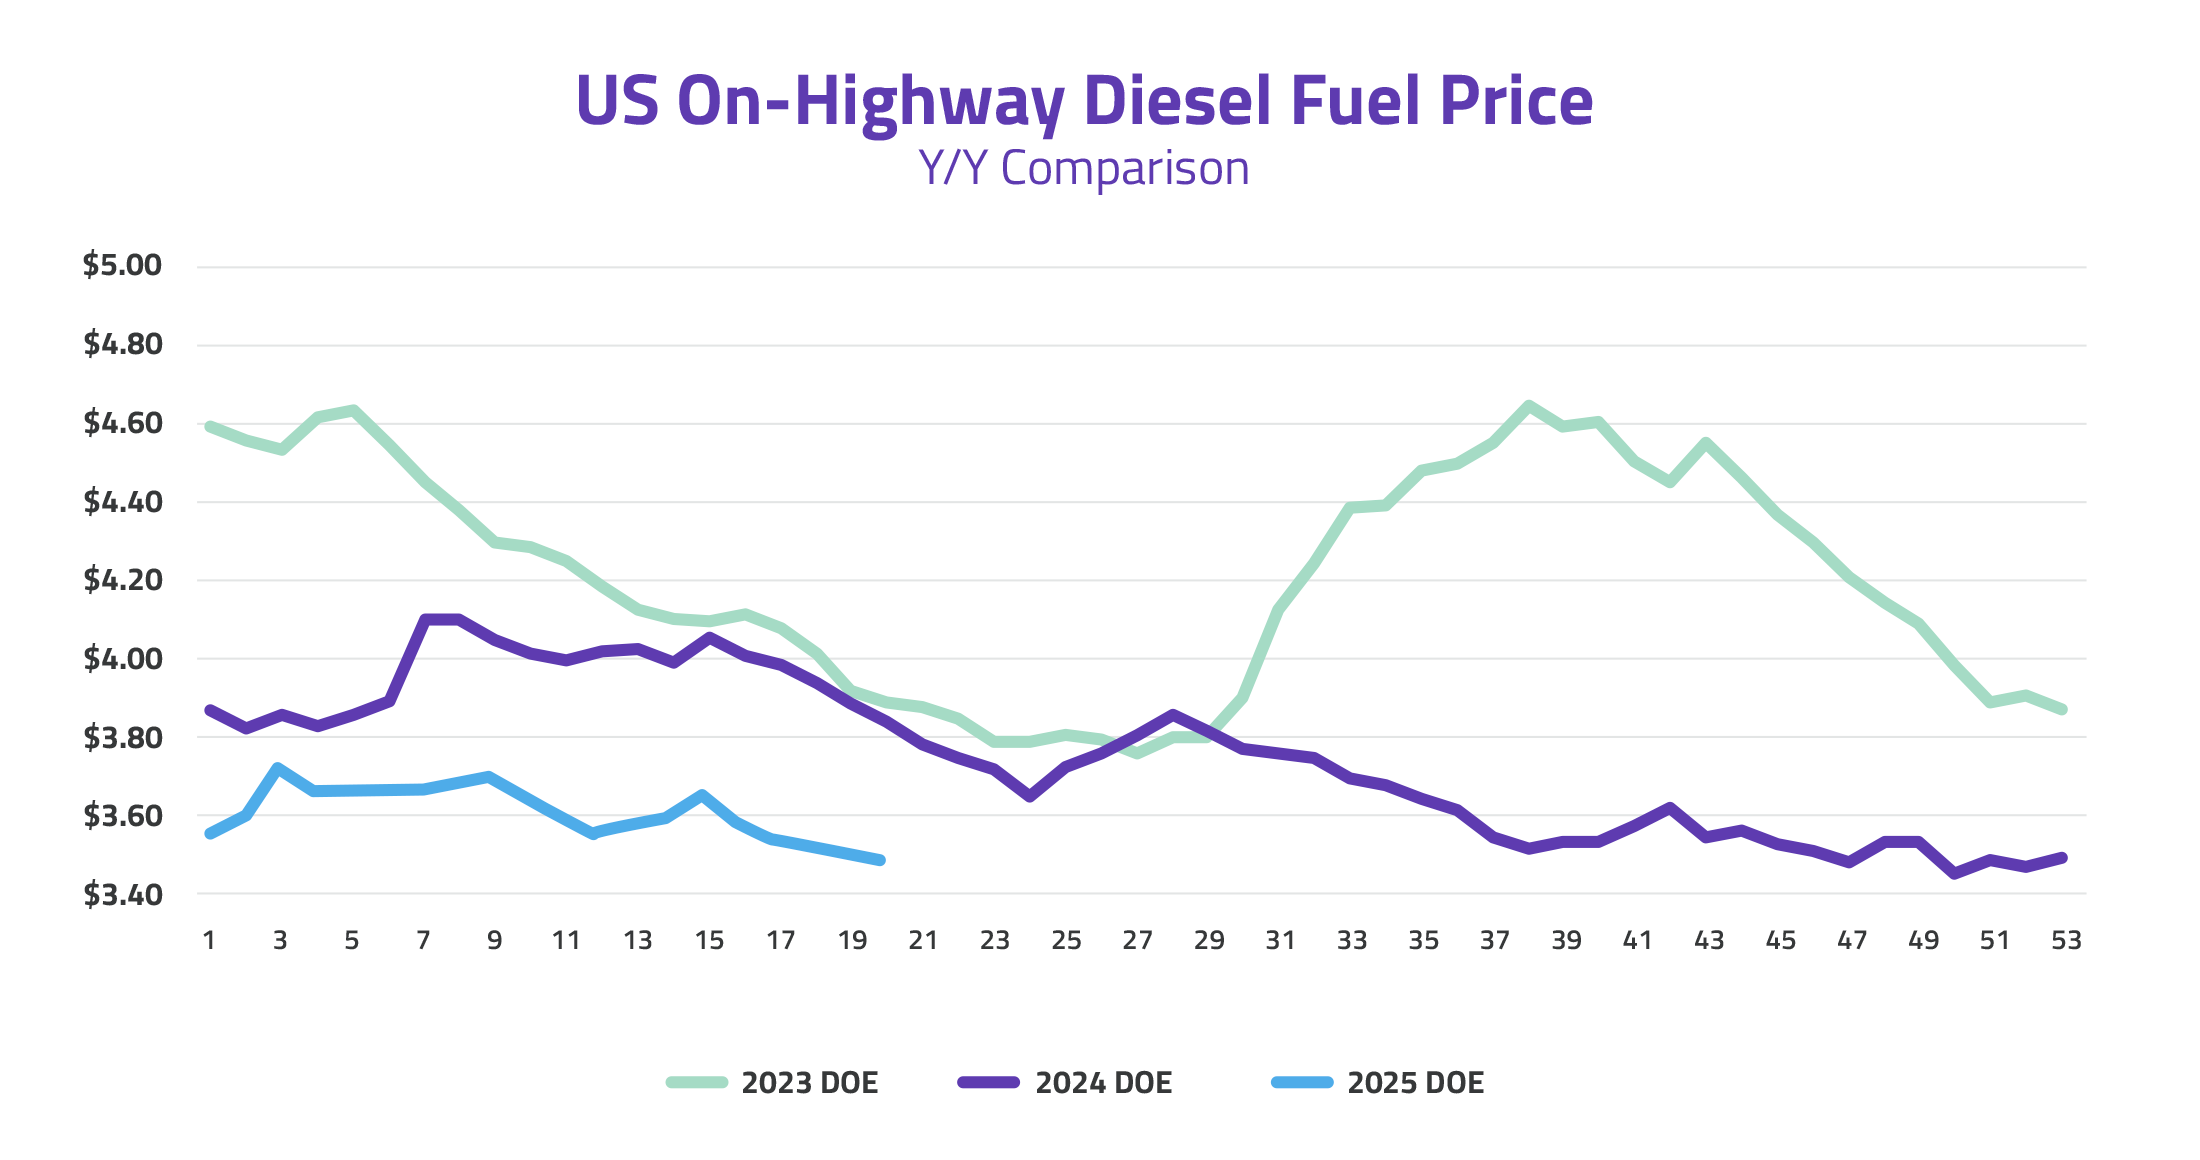
Diesel prices continue their downward trajectory and currently sit at $3.47, the second lowest reading in the last 12 months and 11% lower than one year ago. This change reflects roughly a $.07/mile reduction in customer FSC schedules.
The EIA cites that recent trade policy shifts and corresponding oil production led to a significant drop in oil prices. The Brent crude oil spot price averaged $68 per barrel (b) in April. They forecast an average Brent price of $62/b in the second half of 2025 with prices falling to $59/b in 2026.
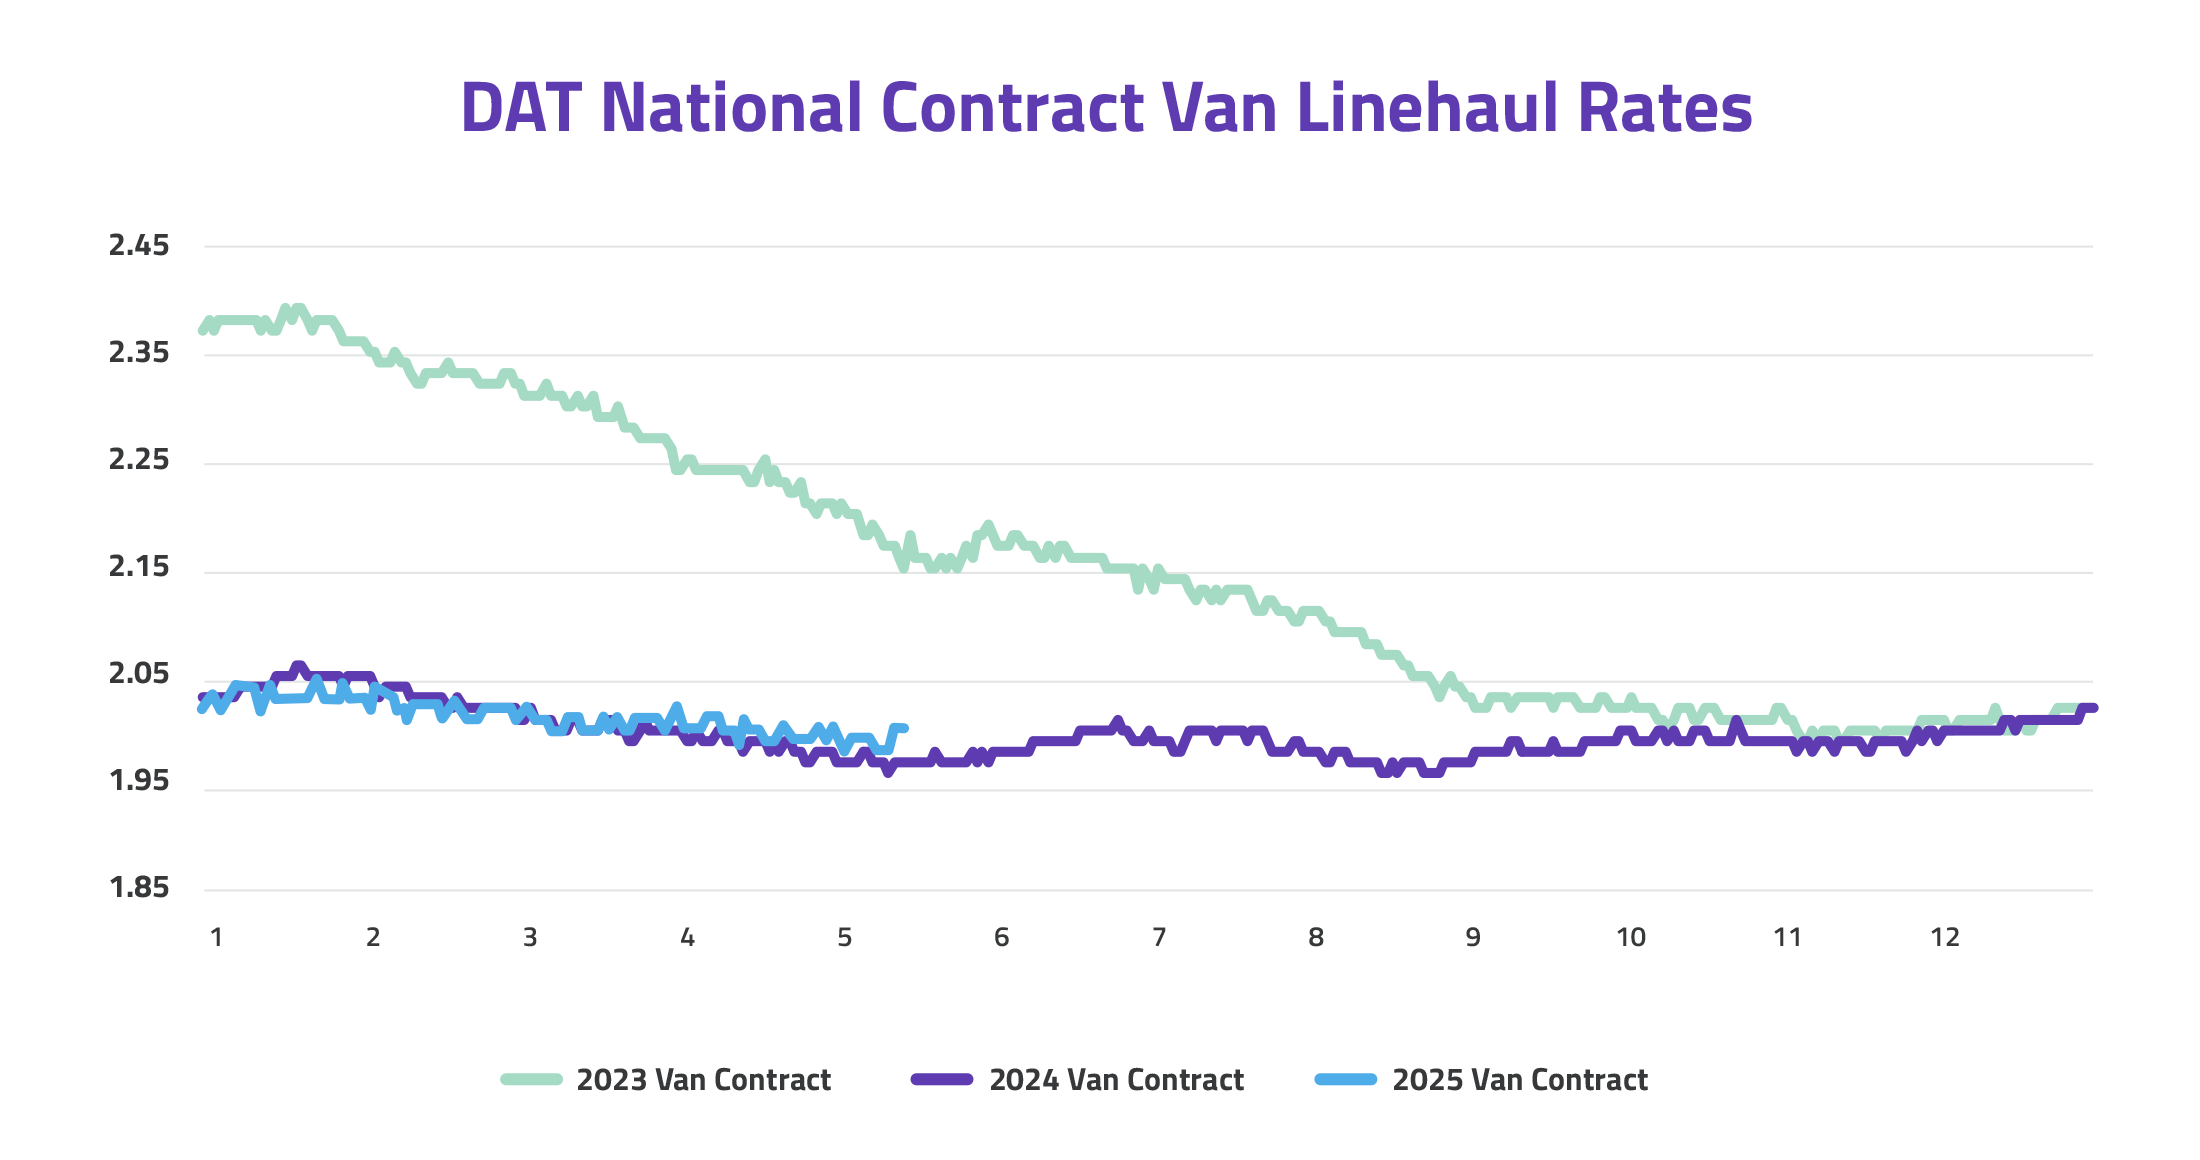
- DAT Daily National Rates – 30-Day Dry Van Contract Average
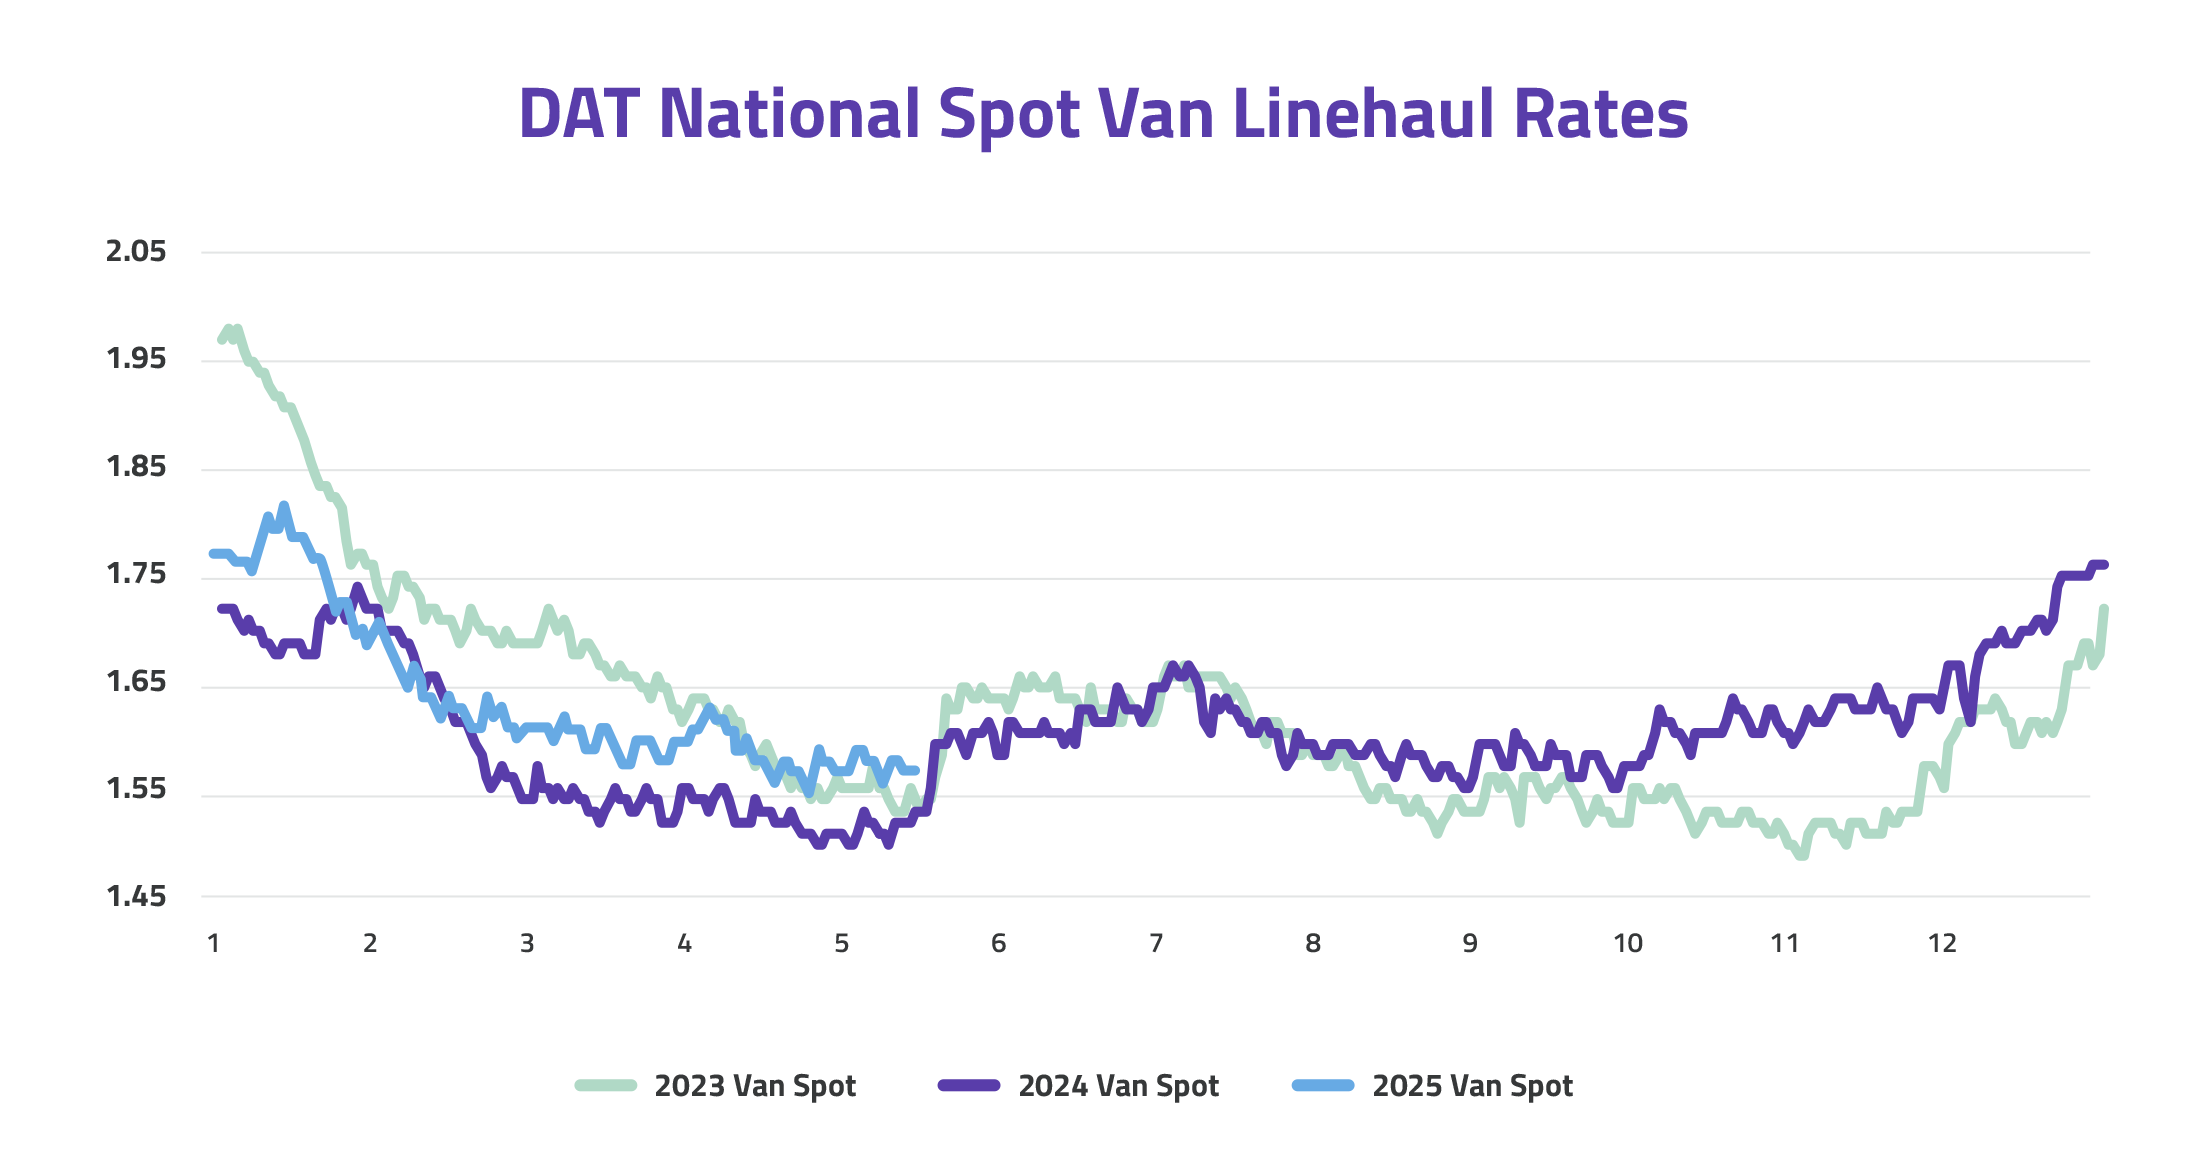
- DAT Daily National Rates – 7-Day Dry Van Spot Average
Capacity supply and freight demand
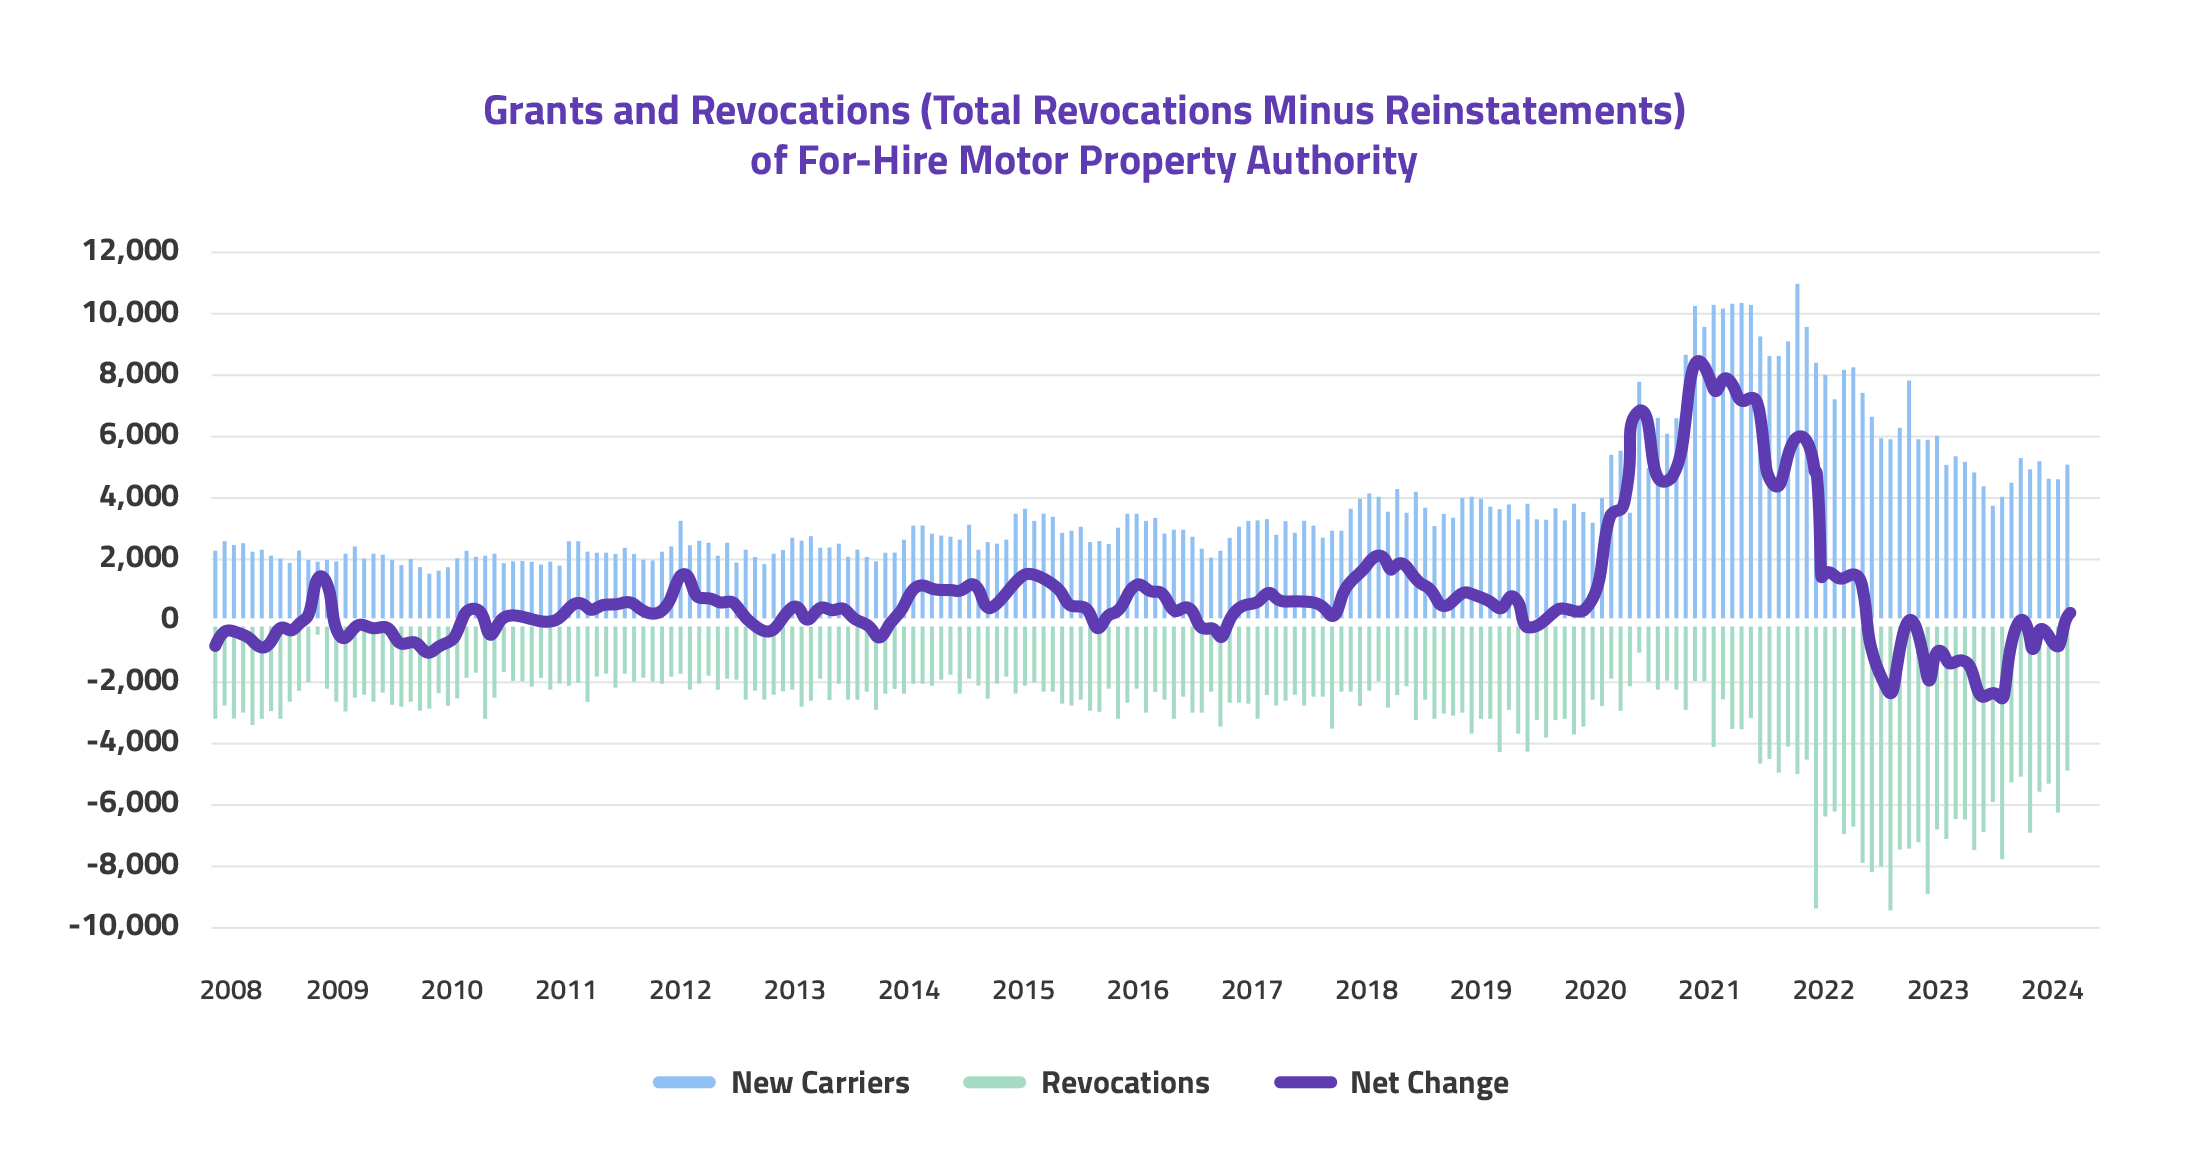
Total operating authorities remain elevated compared to the start of our previous freight cycle in 2Q2020; however, the rate of authority revocations has slowed. Until recently, it appeared that capacity was near a point of equilibrium reflected through improving year-over-year pricing conditions, but revocation data in the coming months could show further reduced capacity if reduced demand continues.
-
Source: Federal Motor Carrier Safety Administration
-
Analysis: FTR Transportation Intelligence
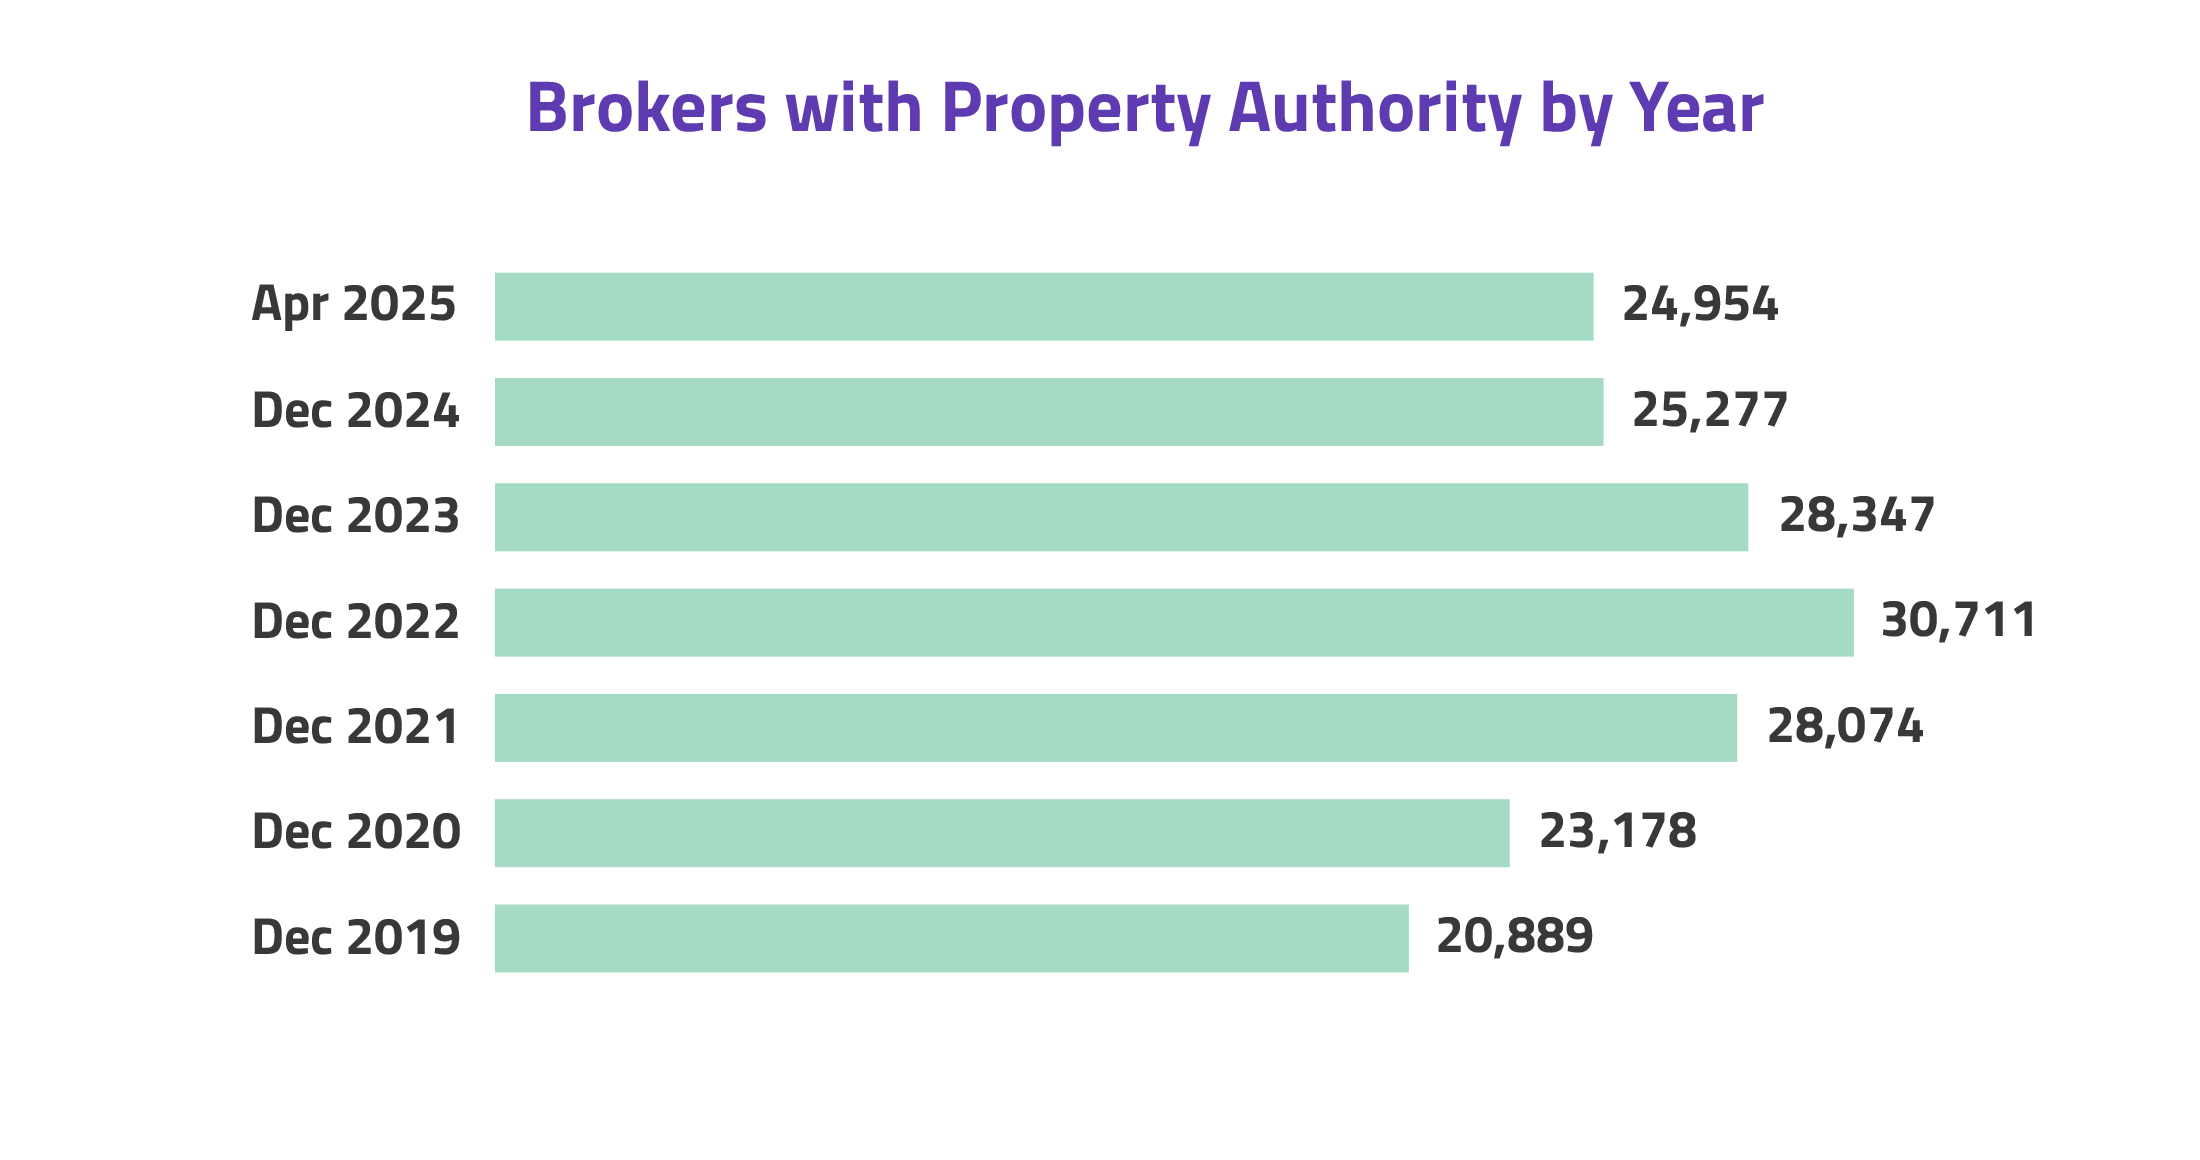
Broker market trends
Brokers continue to face operating headwinds even as spot rates begin to show year-over-year growth. According to data provided by FMCSA, property broker operating authorities began to decrease as the market tightened. As of February 2025, active property broker operating authorities are down 18.7% from their 2022 peak.
More carrier and broker failures are undoubtedly on the horizon as operating costs continue to rise, and rates remain low through mid-2025. Internal network supply chain disruptions are avoidable; however, by deliberately partnering with brokers who understand market cycles and internal costing and possess the financial stability and multi-cycle history to weather freight recessions.
- FMCSA Analysis & Information Online (A&I) report
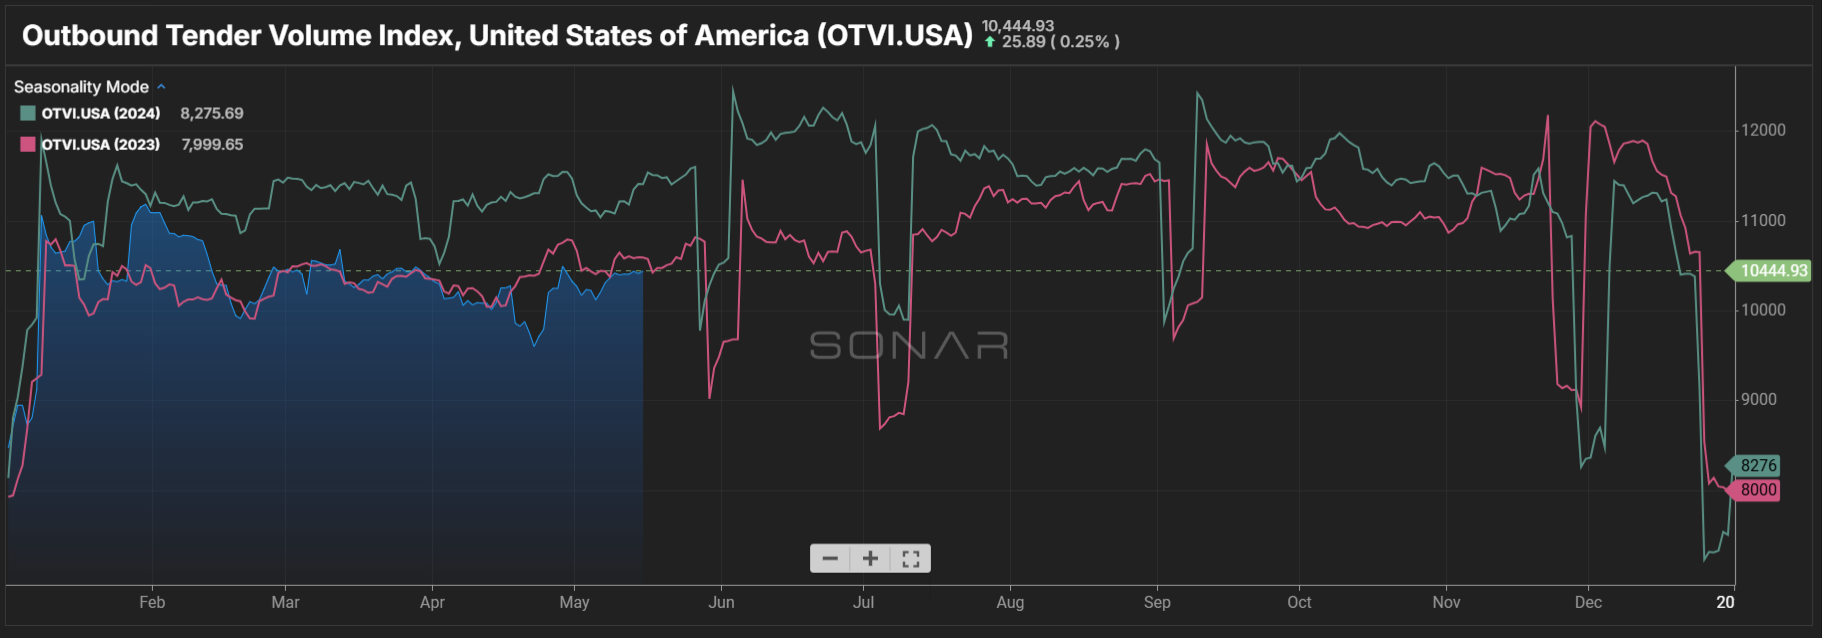
Freight volumes and tender rejections
Outbound tender volumes, as reported by Sonar, are currently lower than those reported in the previous four years. 1Q2025 volumes reflected normal seasonality, but the traditional start of spring produce season remained subdued. A great deal of uncertainty exists in the market as shippers attempt to navigate changing tariff conditions and falling consumer sentiment.
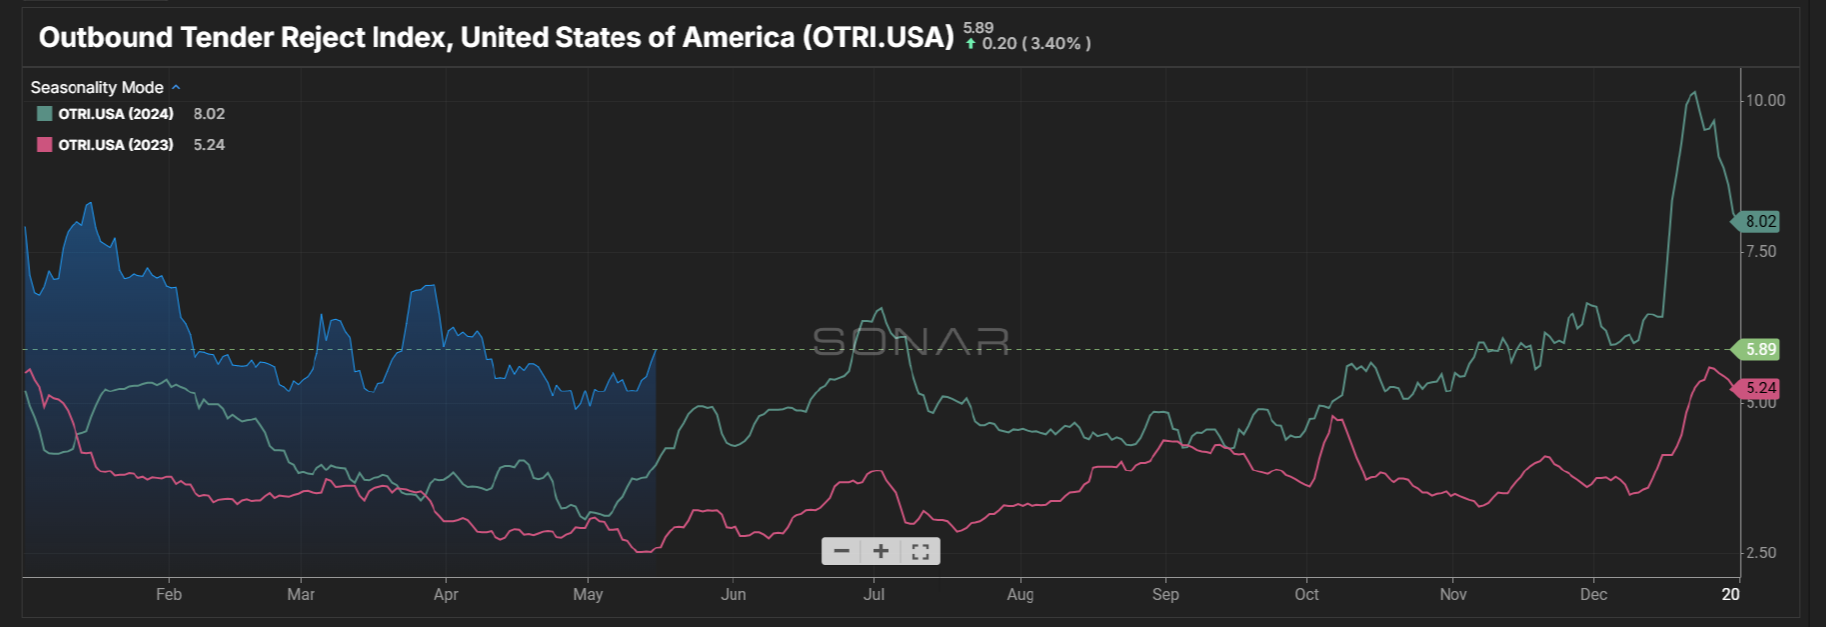
Sonar’s Tender Reject Index remained above 5% for the first quarter. Crossing the 5% threshold could point to a return to a more balanced freight market, especially given lower year-over-year volumes in the quarter. It remains to be seen if this elevated level of tender rejections is driven by routing guide pressure, reduced capacity, or shifting supply chains adapting to a post-tariff environment. Generally, rejection rates in the 5% - 8% range indicate a more balanced market. Additionally, rejections could rise if spot rates continue to show year-over-year growth and extended contractual agreements negotiated at the rate floor become less attractive.
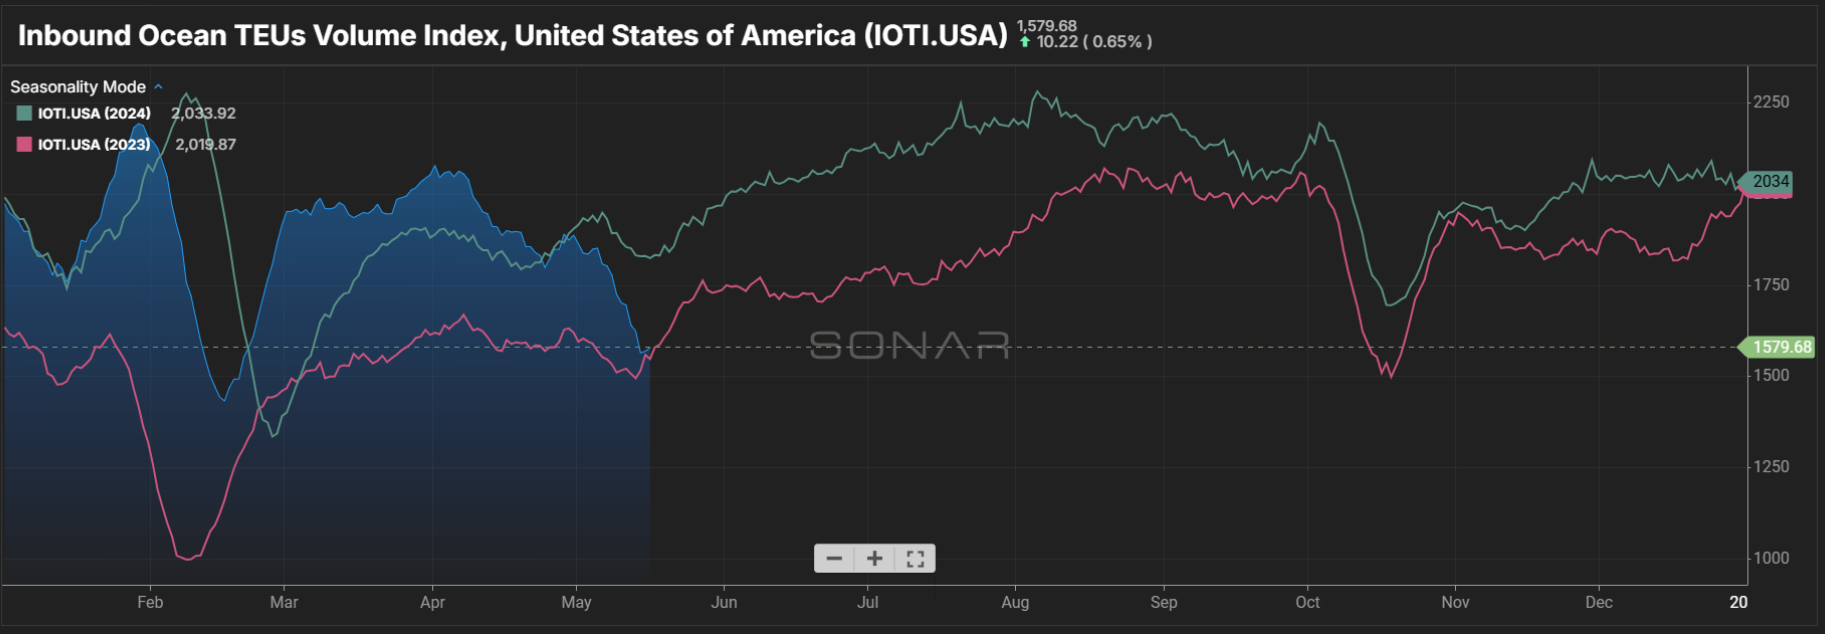
Imports
In the first quarter, import ocean TEU volumes ran higher than in the previous two years as shippers worked to move ahead of potential tariffs. TEU volumes dropped considerably in May as tariffs on China impacted supply chains. For the week of April 14, booking volumes from China to the U.S. dropped 45% compared with the same period one year earlier, according to Vizion, a container tracking service.
The overarching thread of uncertainty driven by trade policy once again presents itself when discussing current market supply and demand conditions. With the 90-day tariff pause with China announced on May 12, Judah Levine of Freightos expects shippers to resume frontloading inventories during the tariff pause which could trigger an earlier-than-usual peak holiday season stating “we’re likely to see a significant demand rebound in the near term as shippers replenish inventories that may have started to run down in the past month, and as many Chinese manufacturers have high levels of finished goods already ready to ship.”
Economic indicators to watch
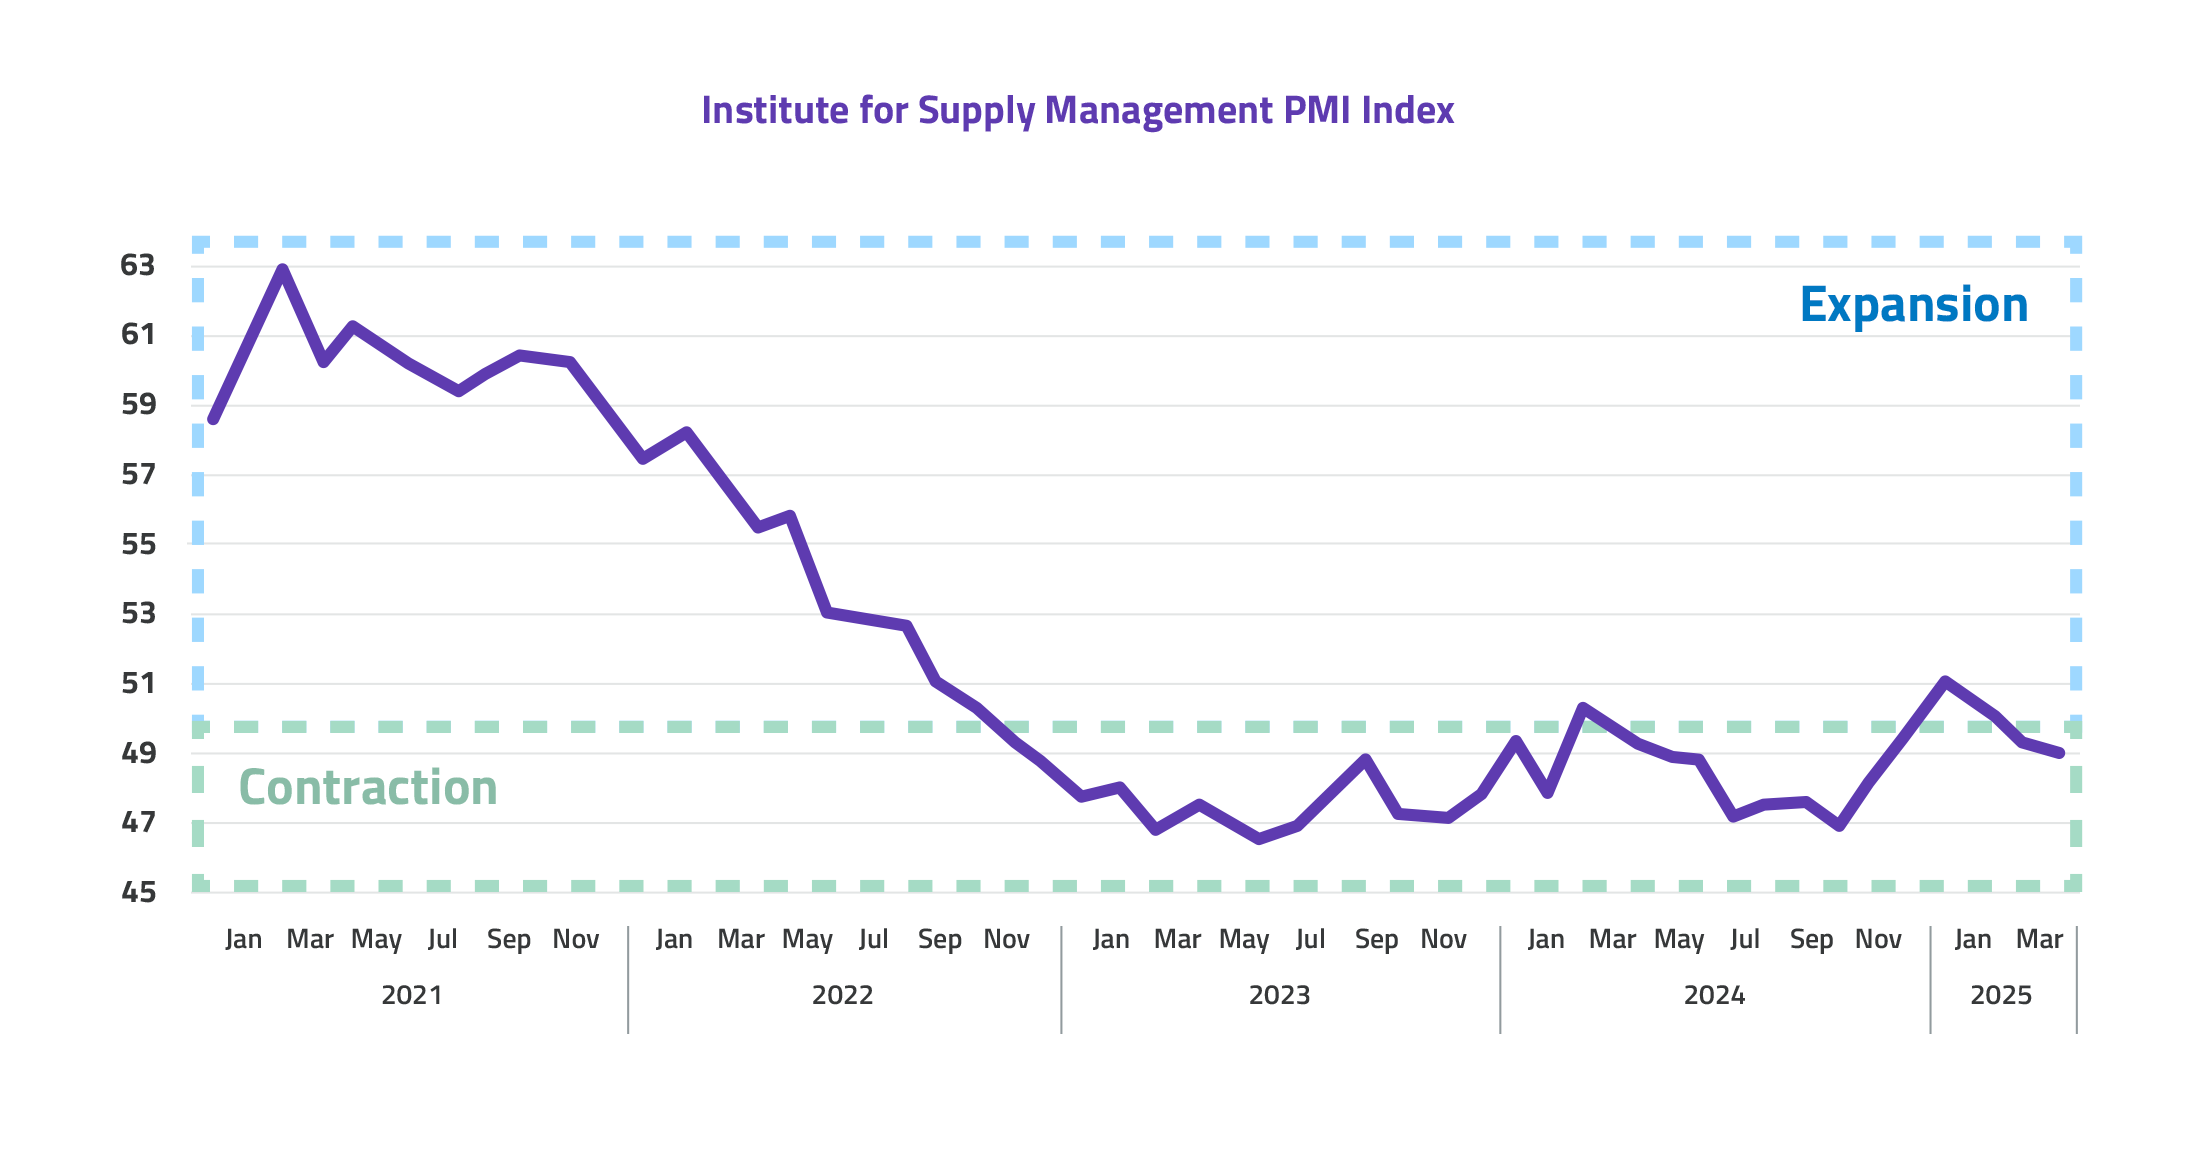
The Institute of Supply Chain Management reported a Purchasing Managers Index reading of 48.7 for March, remaining in contraction territory. The New Orders subindex, a leading indicator of overall manufacturing health, remained in contraction for the third month in a row with a 47.2% posting.
Tim Fiore, chair of the ISM PMI survey, said: “Demand and production retreated and destaffing continued, as panelists’ companies responded to an unknown economic environment. Prices growth accelerated slightly due to tariffs, causing new order placement backlogs, supplier delivery slowdowns and manufacturing inventory growth.”
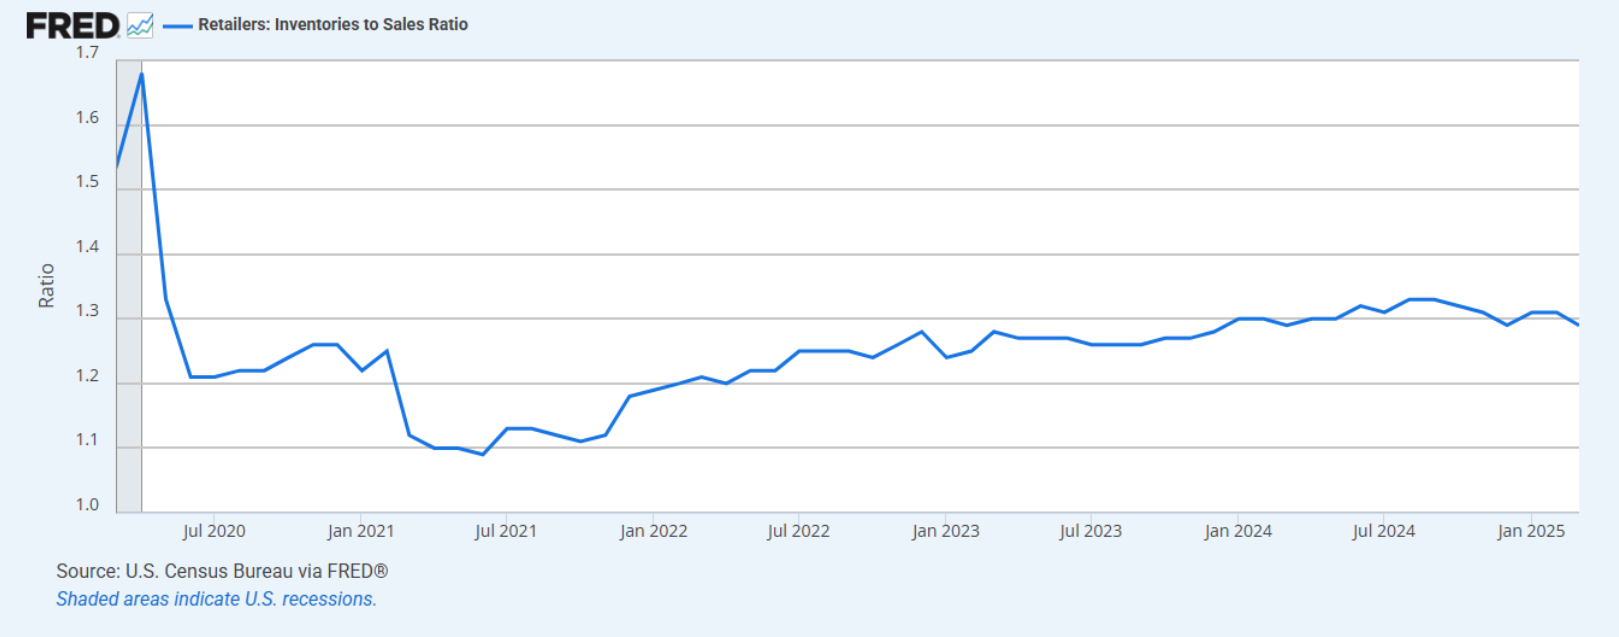
Retail inventories declined in April to 1.29. Overall inventories remain in optimal range but could temporarily rise as the pre-tariff stock-up hits retailers' warehouses. With potential cost increases related to tariff policy once again on the horizon, order and inventory management remains top-of-mind for U.S. retailers as they balance the cost tradeoffs of leaner inventories against potentially higher prices and stockouts.
Key takeaways
- Spot rates are up year-over-year, and contract rates would usually follow i n the upcoming quarters.
- Q2 seasonal demand is off to a sluggish start as freight volumes trail levels of the previous four years as economic uncertainty persists.
- The supply/demand equation is reaching equilibrium with tender rejections, indicating a balanced market even on reduced year-over-year volumes.
- With the 90-day pause on tariffs from China, we could see a supply/demand bullwhip as shippers frontload peak merchandise to the uncertainty that persists in US global trade policy.
- A true freight market recovery is not expected in 2025
By understanding these market trends, businesses can better navigate current conditions and prepare for shifting demand patterns in the months ahead. Our truckload team is here to help you succeed no matter what the market is facing. Contact us today for help with your next shipment.
About ArcBest Truckload
ArcBest Truckload delivers reliable freight shipping solutions for businesses looking for a dependable full-truckload shipping partner. Our best-in-class truckload brokerage service, MoLo®, backed by our robust asset-based network, ensures customers have the capacity and flexibility to manage their national, regional and cross-border shipments efficiently.